Principles and design of isothermal titration calorimetry experiments
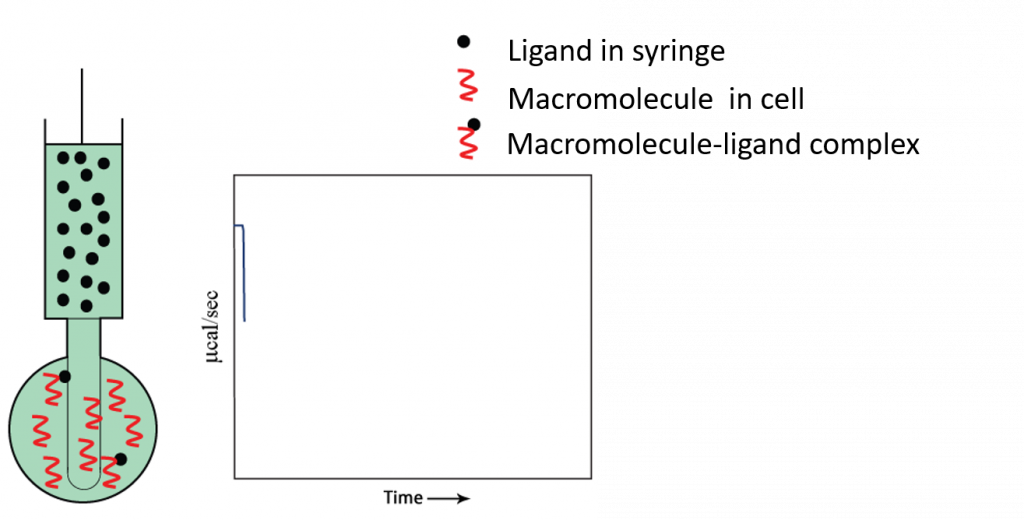
Performing an ITC experiment
- Ligand in syringe
- Macromolecule in sample cell
- Heat of interaction is measured
Parameters measured from a single ITC experiment:
- Binding constant
- Enthalpy
- Stoichiometry
How does ITC work?
The DP is a measured power differential between the reference and sample cells to maintain a zero temperature between the cells.
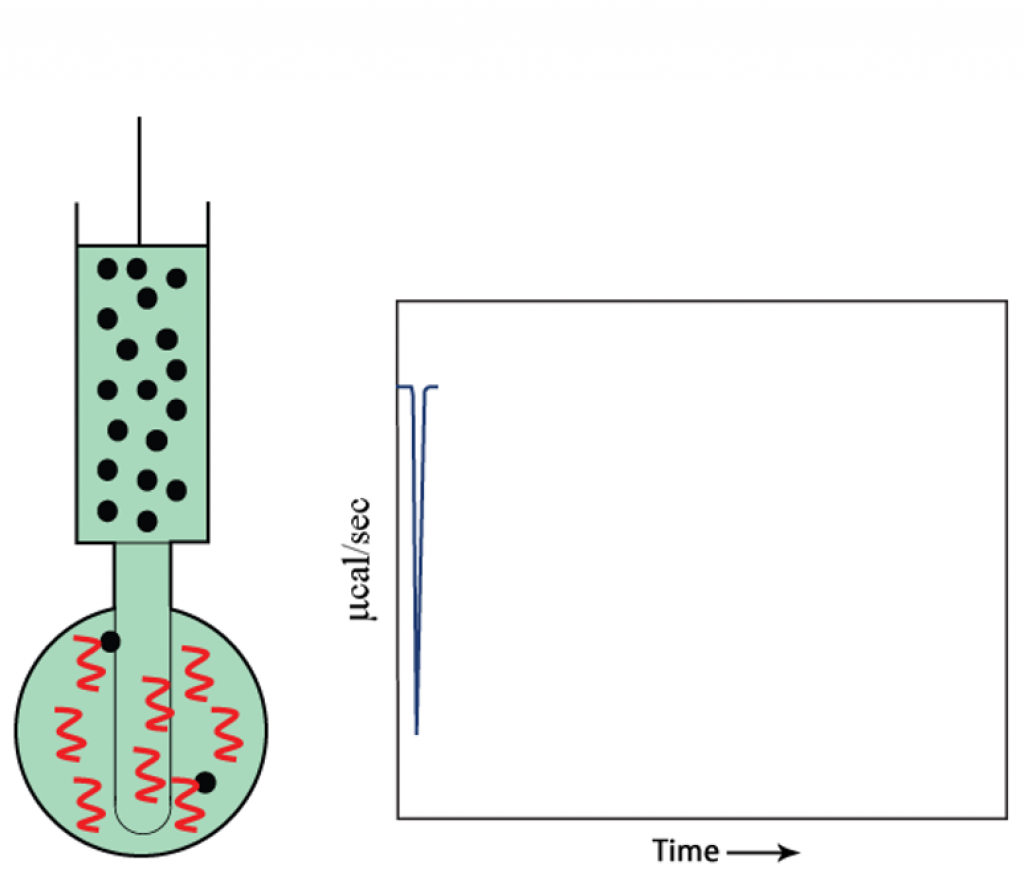
Titration begins: first injection
As the first injection is made, all injected compound is bound to target protein.
- The raw data is plotted as the first titration begins.
- The signal returns to baseline before the next injection.
- As the injections continue, the target becomes saturated with compound, so less binding occurs and the heat change starts to decrease.
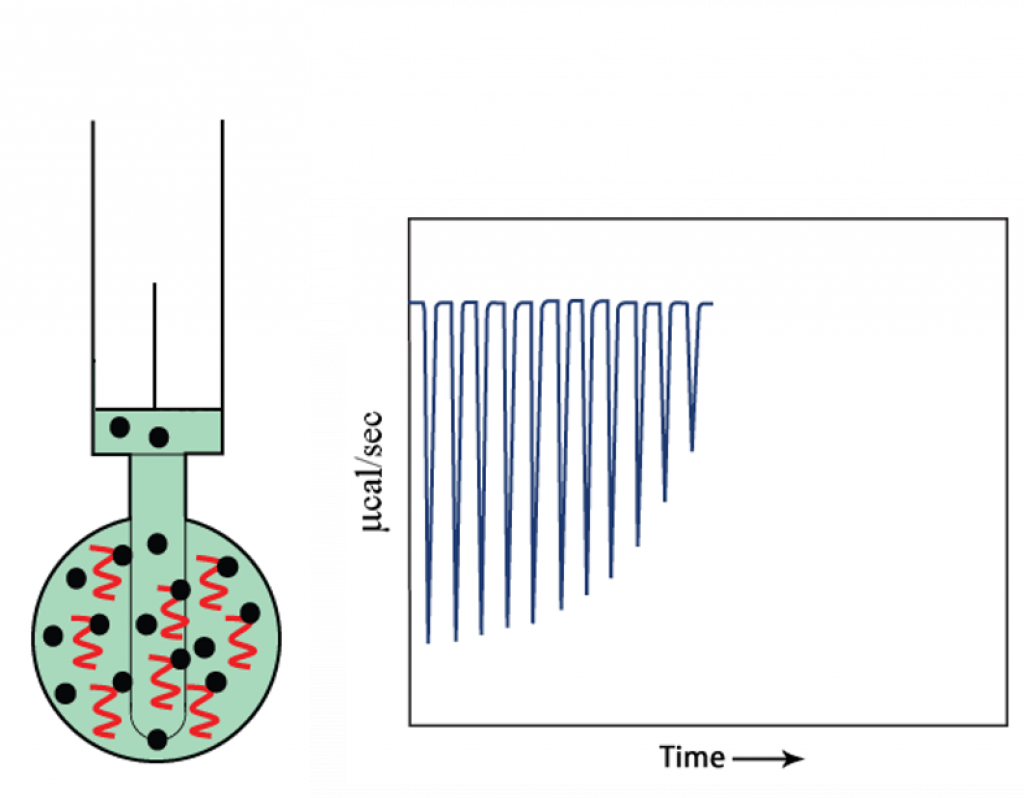
- At the end of titration, when the target is saturated with compound, no more binding occurs and only heat of dilution is observed.
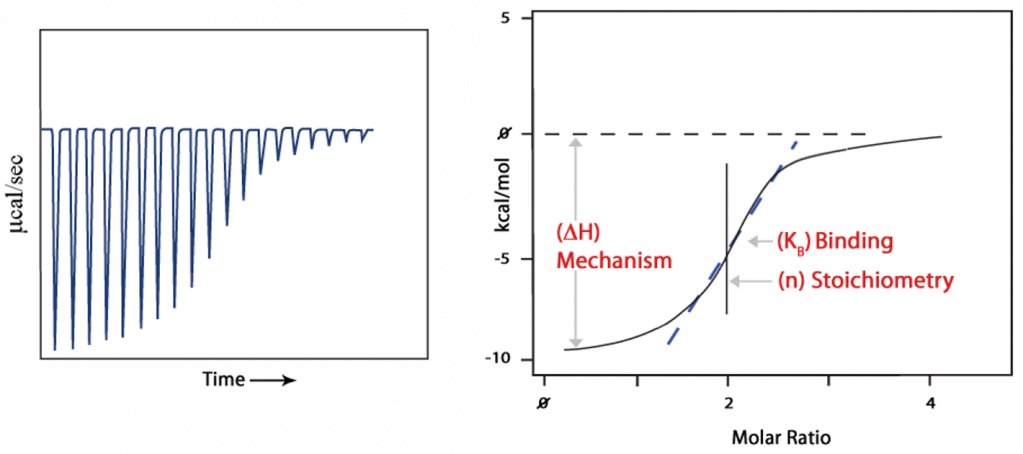
Experimental results
- A binding curve is then obtained from a plot of the heats from each injection against the ratio of ligand and binding partner in the cell.
- The binding curve is analyzed with the appropriate binding model to determine K (binding affinity), n (number of binding sites), and ΔH(enthalpy).
Binding
- KD, the dissociation constant, is in units of concentration.
- This figure highlights that mM affinity describes a weak interaction whereas nM is a relatively strong interaction.
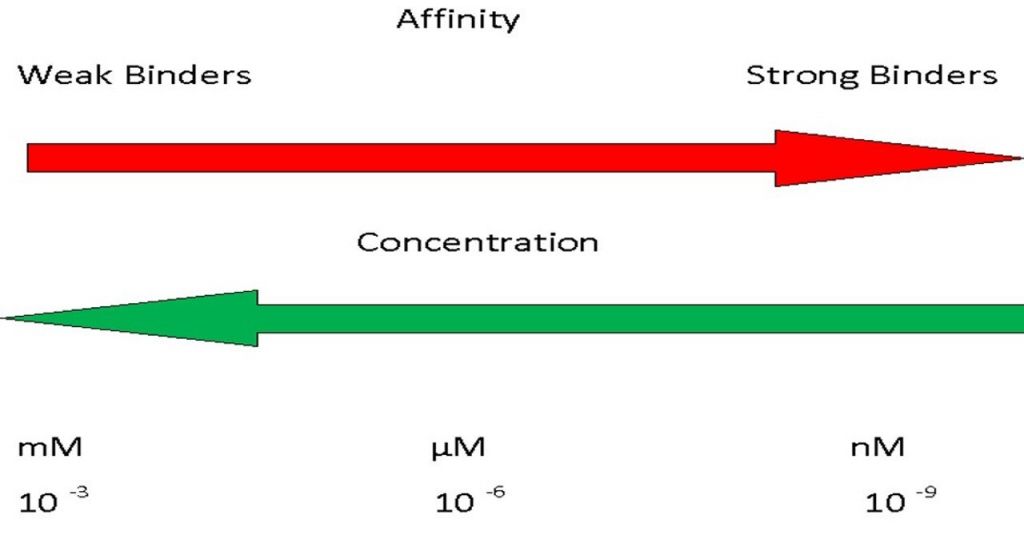
- This is intuitive if one considers that a weak interaction needs a high concentration of material to force binding to happen whereas a strong interaction can occur even when the molecules are very dilute.
ITC practical considerations
The major steps to the acquisition of good-quality data are as follows:
- Good experimental design - use correct concentrations
- Good sample preparation
- Accurate concentration determination
- Use correct run parameters
- Perform appropriate controls experiments
ITC experimental design
The table below is a summary of the recommended starting concentrations you can use if you have some idea about the affinity KD from another technique such as Biacore or even an IC50.
0.3-3 <0.3
| D (Biacore) μM | [Compound] μM | D |
|---|---|---|
| 10 | >20 | |
| 30 | 15-60 | |
| 50 | 5-25 | |
| 30 | D (Biacore) | |
| 30 | D (Biacore) |
Clearly these suggestions could be ignored and your favorite C value could be utilized. The values tabulated here are intended to give high-quality binding isotherms with the minimum use of protein. They are based on the experience of expert users coupled to a sensitivity to protein consumption. The low c value measurements are recommended for affinities weaker than 10 μM because 50 μM often represents the maximum amount of material that users are willing to commit to determine an affinity. The user can decide to use more, and perform traditional-style experiments. In any case, this table represents a very useful guide to all users for experimental design. In the absence of any guidance or prior knowledge, we recommend that the researcher use the values in line 1 because this covers the broadest affinity range (10 μM to10 nM-tighter for ΔH and N) and the lowest amount of protein. A couple of examples in usage of these recommendations are shown in the next couple of slides.
Good starting conditions
With little prior knowledge, these parameters are a good place to start:
- 100 μM ligand in the syringe and 10 μM macromolecule in the cell
- Detect KDS of 10 μM to 10 nM
- Ideal for KDS of 2 μM to 100 nM
Choice of buffer
Buffers have ionization enthalpies as shown in the figure below.
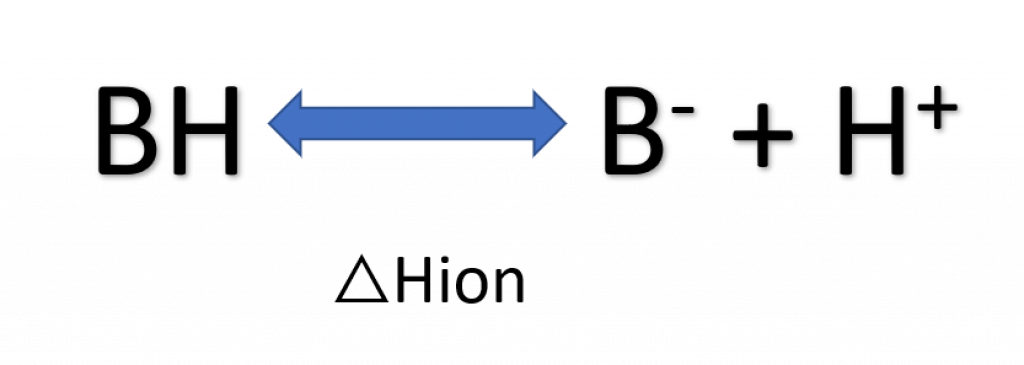
- Use buffers with ΔHion ~ 0, including phosphate, acetate, formate, citrate, sulfate, cacodylate, and glycine
- Quaternary amines (e.g. Tris) have high ΔHion
How to choose a good buffer:
- First, identify the buffers in which the macromolecule and ligand are stable, taking into account pH and solubility.
- Sometimes additives are required for binding, stability, and solubility (e.g. salt, detergent, or reducing agents).
- Use buffers with a sufficient concentration to prevent pH effects.
- Are the macromolecules and ligands ionizable, and at what pH are they neutral?
Sample preparation
Good sample preparation is key to most techniques, and ITC is no exception.
- The material should be exchanged into buffer using dialysis or desalting column.
- If diluting from stocks, ensure the pipettes are calibrated or use a balance to check volumes.
- You should retain the exchange buffer for use as the reference solution.
- Centrifuge to remove any aggregated material or filter (but beware aggressive filtering can denature proteins).
- Adopt and stick to a standard reproducible protocol
Buffer mismatch - no dialysis
The consequences of not exchanging/matching buffers are highlighted in the figure below. The two data sets represent the titration of the same two interactants before (top) and after (dialysis).
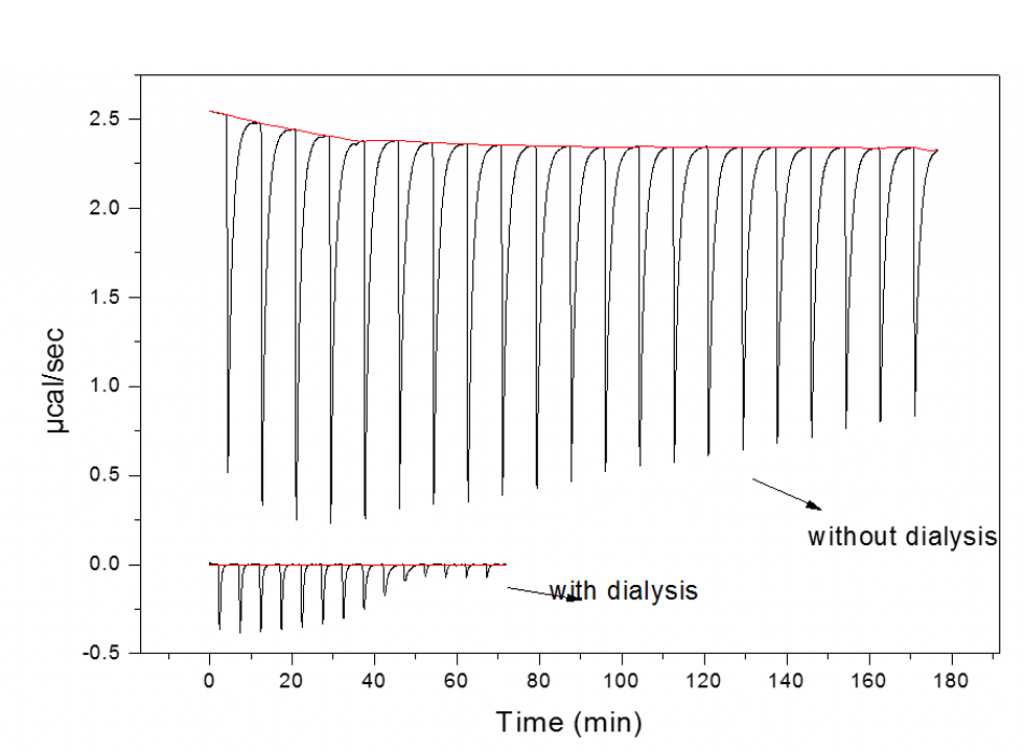
The top data have large peaks due to heats of mixing co-solutes and not the binding partners. These heats of mixing completely mask the heats of binding. There are many instances where the ideal of dialyzing both components is not possible. This occurs when one or both of the molecules are too small to be retained within a membrane. In such instances where one component is too small (e.g. protein:small molecule interactions) it is normal practice to dialyze the protein and to use the dialysate to dissolve the binding partner which may be in a solid form or, more commonly, stored at high high concentration (often~20-100 mM) in DMSO.
- In the former case it is good to try and make sure that the compound is as pure as possible so as to prevent the contaminant from being the cause of mismatch.
- When the compound is in the DMSO it should be diluted with the exchange buffer/dialysate so that the final concentration of the organic solvent is 5 % or less.
- The same % of DMSO should then be added to the protein solution to avoid mismatch.
It should also be added that if larger heats than expected are observed then it is good to check the pH of the two solutions.
- They should be no more than 0.1 pH units different.
- Shifts in pH are most common when the concentrations of the ligand are high.
- This can cause a shift in pH if the buffer capacity is too low.
In such cases the buffer concentration should be increased and/or a buffer chosen with a pK closer to the experimental pH.
Concentration determination
- Absorption
- Measurements should involve "wavelength scanning" (i.e. large errors with single wavelength measurements)
- DTT absorbs at 280 nm
Good experimental design and buffer matching will get you good-quality data, but this can be compromised if you do not measure the concentrations accurately.
Protein concentrations should be measured using absorption of UV light between 340 and 260 nm (or a similarly effective method).
- This should be done using good control solutions such as the exchange buffer.
It should be noted that oxidized DTT has a strong absorption in this range (i.e. it absorbs more at 280 nm the older it gets so care should be used with similar aged samples in such cases).
Sample preparation: small molecule ligand
- If ligand is too small to dialyze, ensure material is desalted prior to final preparation.
- Use final dialysis buffer of macromolecule to dissolve ligand.
- Match pH.
Ligand concentration in syringe
- Ligand - 10-20x molar concentration of macromolecule
- Minimum 50 μM
- May need to adjust based on experiment
- At end of ITC, for N of 1, want final ligand/macromolecule ratio to be 2:4 to ensure saturation of all binding sites
ITC enthalpy changes
ΔHobserved by ITC is total of:
- ΔHbinding
- ΔHionization
- ΔHconformation
Any non-specific effects (buffer mismatch, pH mismatch, heat of dilution, heat of ligand dissociation) must be accounted for by appropriate controls and experimental conditions.
Controls
During injection of syringe material into buffer, peaks should be similar in magnitude to those at the end of the titration experiment and constant; control peaks should be small and equal in magnitude to one another.
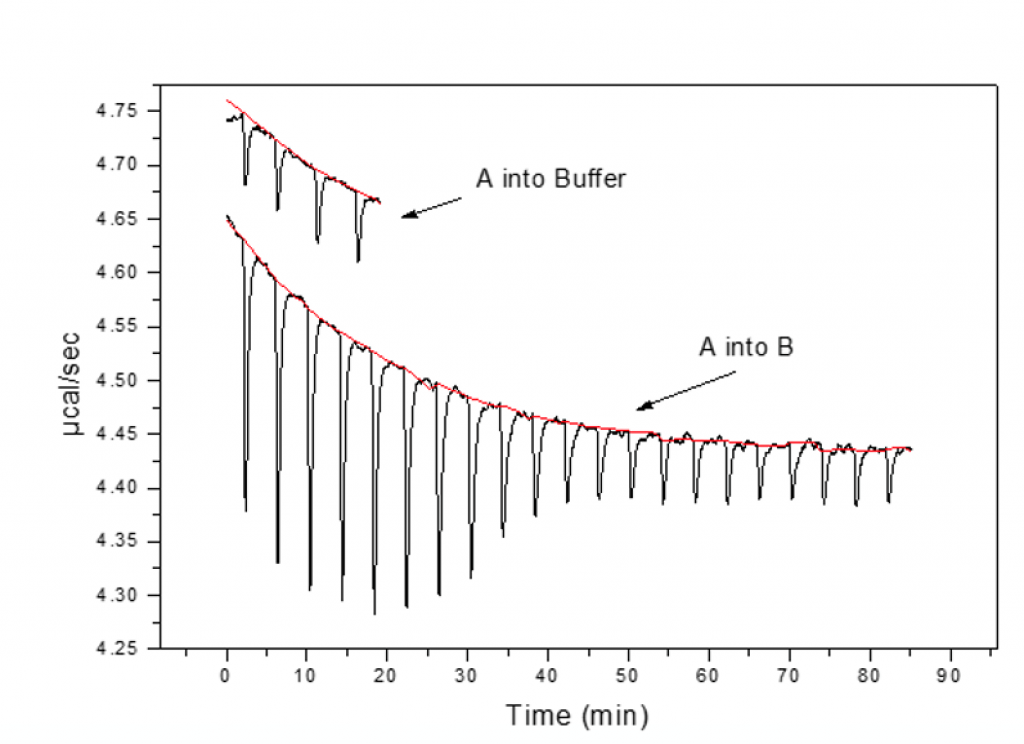
This confirms that there is no heat from dissociation and that the solvents are reasonably matched.
For each ITC experiment...
- Start with a clean cell and syringe
- Prepare macromolecule and ligand in matched buffer
- Perform control titration(s) to establish heat of dilution
- Use a proper filling technique
- Set appropriate scan parameters to generate full-binding isotherm
Experimental conditions
For full characterization of binding interaction, need to do experiment at different conditions
- Temperature
- pH
- Buffer
- Ionic strength
For comparison studies (e.g. mutant protein studies, drug binding screening) need to do experiments at identical conditions
Acknowledgement
Source materials courtesy of Verna Frasca, Ph.D., GE Healthcare