Principles and design of differential scanning calorimetry experiments
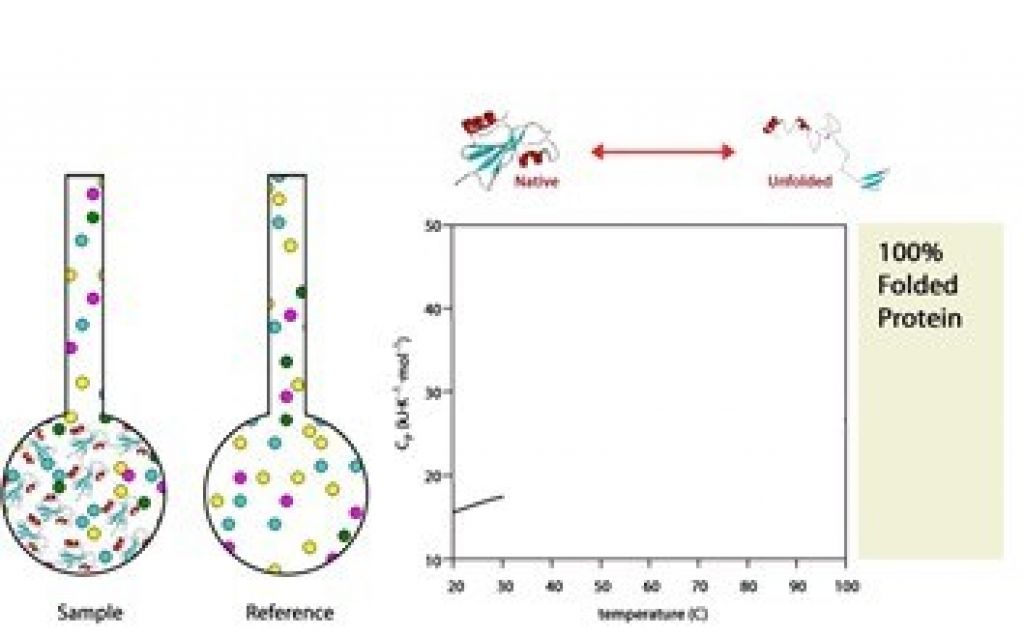
Differential scanning calorimetry — the basic setup
The DP is the differential power added to maintain ΔT~0 between the cells.

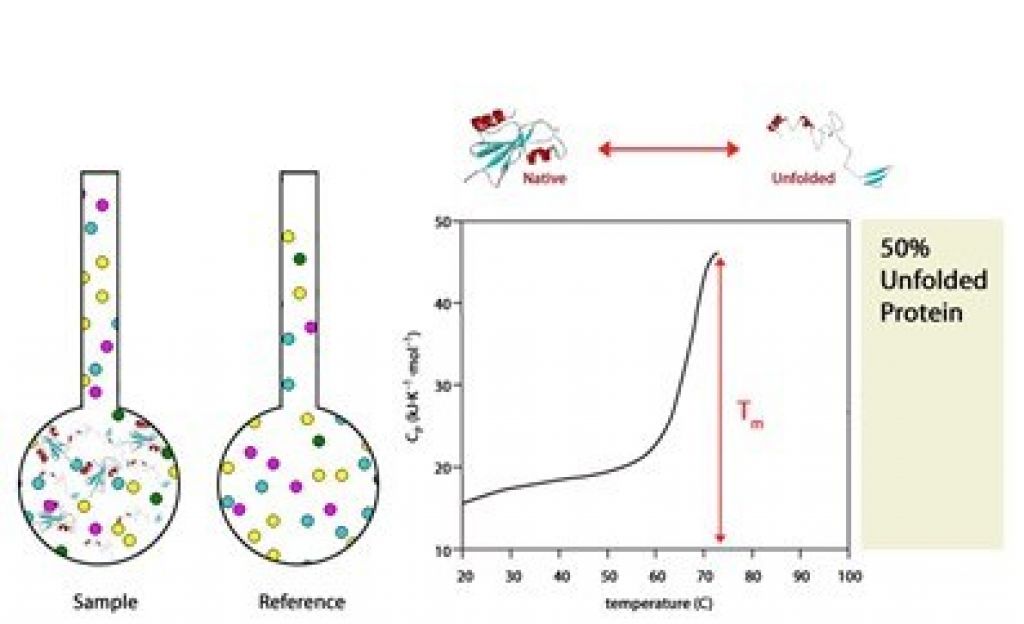
Tm — an indicator of thermal stability
- What does the Tm value mean?
- Tm corresponds to 50% folded/50% unfolded of a protein.
- From general biochemistry – most anything that stabilizes the conformation of a protein will cause the protein to unfold at a higher temperature.
- Anything that destabilizes a protein will cause it to unfold at a lower temperature.
- Stability is affected by both intrinsic factors within the molecule and extrinsic factors like pH, excipients, and preservatives.
The process begins at a lower temperature when the protein is native and folded.
As the temperature increases, the Tm is highest when 50% of proteins are folded and 50% are unfolded.
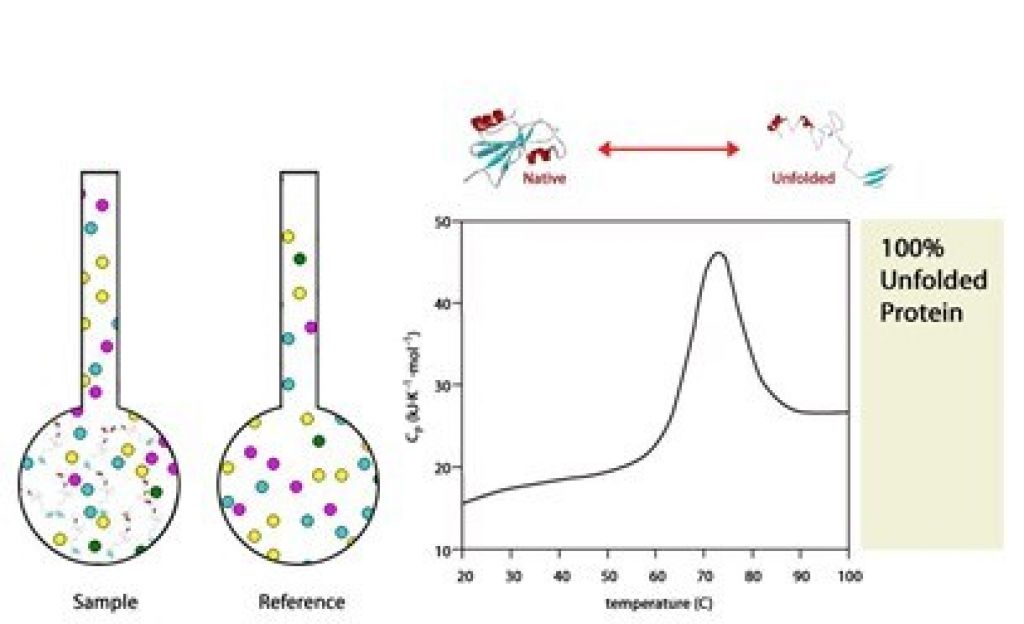
At the completion of the experiment, 100% of protein is unfolded.
Compare native, altered, and mutant forms.
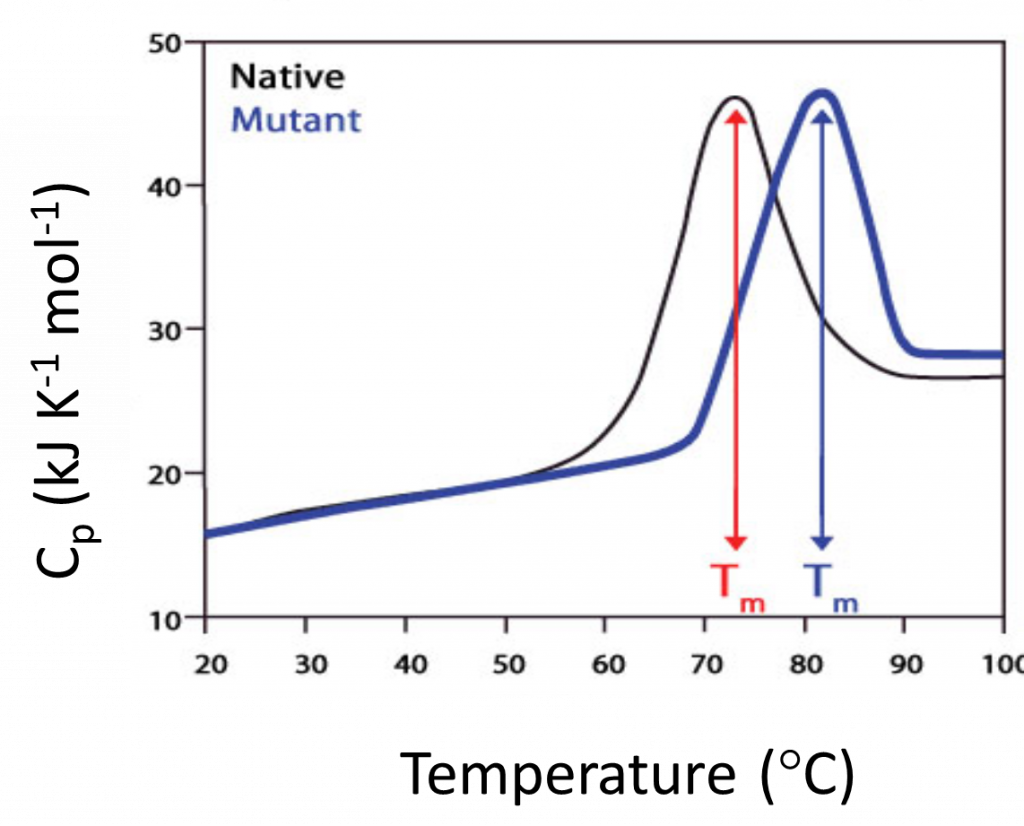
- Optical clarity unimportant
- Tm shift reflects increased stability
- Tm, and ΔHcal in one scan
The shift, as illustrated here, can be caused by factors such as mutation, post-translational changes such as phosphorylation, or from the formation of a complex. By studying the Tm shift over a range of different ligand concentrations, the affinity of the interaction can be calculated. The key benefit with DSC is that it is based on heat measurements and therefore allows the characterization of native biomolecules. Furthermore, the lack of spectroscopic readings means that the samples do not have to be optically clear. In addition, the characterization is not limited to the melting temperature or Tm, but it also provides data on the forces involved in folding of the biomolecules and the mechanisms by which they unfold.
Parameters
When analyzing DSC data, the most obvious feature is the Tm.

- If it moves upward with sample concentration, then sample is oligomer.
- If downward, protein oligomerizes in denatured state.
- If co-solute increases Tm, then probable increase in shelf-life-formulations.
- If additive at stoichiometric concentrations increases Tm, then we have specific binding.
- The higher the Tm, the more stable the protein.
- Enthalpy: a theoretical baseline is drawn and the area is the enthalpy.
- The step in pre- and post-transition baselines is the DCp.
Thermal transition midpoint - Tm
- Tm – Transition midpoint (melting temperature)
- Molar heat capacity maximum, corresponds to midpoint of unfolding transition.
- Temperature where [native protein] = [denatured protein]
- At Tm, ΔGunfolding = 0
- Indication of thermal stability
Enthalpy - ΔH
- Energy absorbed in raising system to temperature T while keeping pressure constant
- Includes translation, rotational energy
- Includes energy associated with changes in inter- and intramolecular interactions (hydrogen bonds, etc.)
- For two state, reversible transition
ΔHcal = ΔHVH
Heat capacity - ΔCp
- Measures ability of biomolecule to absorb heat energy without increase in temperature
- Contributions from polar and apolar groups. Liquid water has high heat capacity due to energy from breaking H bonds.
- Need to subtract water effects from ΔCp measurements by use of reference (buffer-buffer) scan.
- Important to have matched buffer in reference cell since excess heat capacity of protein is measured in DSC
Entropy - ΔS
Hydration and conformational entropy
“Molecular disorder”
Gibbs free energy - ΔG
At Tm, ΔGunfolding = 0
At Tm, [N] = [U]
Typical DSC thermogram

Concentration requirements
- Depends on the molecular weight of the protein
- Minimum concentration 0.02 mg/ml (~10 μg)
- As starting point, min 0.1-0.2 mg/ml
- Maximum concentration 50-100 mg/ml
Sample preparation
- Exchange material into buffer using dialysis or desalting column.
- If diluting from stocks, be very careful; use a balance rather than pipettes.
- You should retain the exchange buffer for use as the reference solution.
- Centrifuge or filter sample if there is a possibility of aggregated material.
- Beware, aggressive filtering can denature proteins.
- Adopt and stick to a standard reproducible protocol.
Choosing a good buffer
- Avoid DTT
- Unstable and undergoes oxidation
- High background heat
- Use β-mercaptoethanol & TCEP
- First, try DSC buffer only
- TCEP is not stable in phosphate buffer
- Ionization enthalpy
- BH ↔ B- + H+
- The larger the ionization enthalpy the more the buffer changes pH with temperature
- Formate, acetate, and phosphate have ΔHion close to 0
Buffers have an enthalpy for the ionization process. Changes in pH can affect the folding stability if the ionizable groups have different pKa values in folded and unfolded state; the pKa is simply a representation of the equilibrium constant for the group between its protonated and unprotonated forms, and if this equilibrium changes during denaturing, then protons will be released or taken up by the protein. Since we always use a buffer that acts to maintain the same pH, the protons involved in the protein denaturing equilibrium will be taken up or provided by the buffer, a process that will have an associated enthalpy; this enthalpy is different for each buffer.
Acknowledgement
Source materials courtesy of Verna Frasca, Ph.D., GE Healthcare